Enhanced Identification Confidence and Specificity for PFAS Analysis Using Cyclic Ion Mobility Mass Spectrometry Collision Cross Sections
仅供研究使用,不适用于诊断。
Abstract
Per and Polyfluorinated alkyl substances (PFAS) exposure is a potential contributor to adverse health conditions including cancer, immunodeficiencies, elevated cholesterol, and cardiovascular disease in the human population. The World Health Organization (WHO) has designated Perfluorooctanoic acid (PFOA) as carcinogenic to humans. Stringent PFAS guidelines are in place in developed countries, however in developing countries production of long chain PFAS continues. Production of alternative “unknown” PFAS is taking place, for which exposure is difficult to evaluate, varying with occupation and geography.
Monitoring of PFAS analytes within the environment uses targeted LC-MS (liquid chromatography mass spectrometry) strategies, for example there are forty PFAS analytes listed EPA 1633. However, the ever-changing PFAS landscape requires implementation of non-targeted analytical strategies to screen for large numbers of “known” PFAS, while simultaneously detecting PFAS degradation products and “unknown” PFAS species. cyclic ion mobility (cIM) provides an added dimension of separation and collision cross sections (CCS) values can provide a complimentary identification descriptor.
CCS values provide an additional identification point across multiple application areas. To highlight confidence of the utility of CCS values, and they are independent of ion mobility (IM) technology, when performing PFAS non-targeted screening assays, we have used an internally developed PFAS library to cross correlate PFAS CCS reproducibility. The SELECT SERIES™ Cyclic™ ion mobility mass spectrometer has been used to perform an inter-site/intra-site comparison and compared published drift tube (DT) ion mobility PFAS CCS values.
Benefits
- HDMSE is a routine and robust non-targeted screening approach that provides additional PFAS specificity that enhances the identification and characterization of per- and polyfluoroalkyl substances (PFAS)
- Compared to PFAS CCS libraries, Δ CCS values < 1% have been obtained routinely. This consistency ensures that the data is reliable and can be confidently used for comparison and identification purposes, improving the accuracy of PFAS analysis
- IMS provided additional specificity that helps in accurately detecting and differentiating between various PFAS analytes, even in complex mixtures, leading to more reliable and comprehensive environmental and health assessments
- Travelling wave ion mobility (TWIM) generated CCS values have Δ CCS < 1% when compared to published PFAS drift tube CCS measurements. CCS can be effectively used for PFAS analysis, providing accurate and comparable results across different methodologies, which is crucial for standardization and validation in scientific research
Introduction
The inert and stable chemistry of synthetic PFAS was discovered in the 1930s. PFAS physiochemical properties rendered utility to produce household and industrial products. Since the late 1950’s products have been produced exhibiting properties of water-repellence (clothing, carpets), heat resistance (building products, firefighting gear), non-stick (kitchen ware), and flame retardants (aqueous film-forming foams (AFFFs)). Products using PFAS, have evolved and become common place in society, far beyond the general awareness of the everyday non-stick pan. PFAS have become part of the fabric of our society: roofing, flooring, artificial turf, furniture, and paint are examples to mention. Notably, to provide grease and water repellence, PFAS have been added to food packaging for decades.
PFAS are commonly referred to as “forever chemicals” because they resist break down in the environment and they bioaccumulate in the body. Exposure to PFAS has been correlated with adverse health conditions including cancer, immunodeficiencies and elevated cholesterol levels. As a result, industrial production of long chain PFAS has been phased out over the last two decades. Although developed countries have implemented stringent guidelines for PFAS, developing/underdeveloped countries continue production and often lack regulations and mechanisms to address emerging PFAS.1-3 A move towards alternative PFAS has occurred, for which the toxicity and environmental fate must be ascertained. The Environmental Protection Agency maintains a database of approximately 14,800 PFAS analytes.4 Considering PFAS moves readily through the environment, contamination is difficult to contain. There have been decades of global contamination, these ubiquitous “forever chemicals” require an “arsenal” of analytical strategies to determine the continued environmental and biological impact on society, of which they are an integral part.
Targeted LC-MS (liquid chromatography mass spectrometry) strategies are used to monitor levels of known PFAS analytes within the environment.5-7 However, the ever-changing PFAS landscape requires implementation of non-targeted screening strategies to detect a large number of “known” PFAS, and simultaneously detect PFAS degradation products as well as “unknown” PFAS species.
The commercialization of products containing PFAS occurred at a similar period to the first coupling of MS and ion mobility (IM) in 1962. There has been a continuous increase in research utilising IM-MS. Ultra high performance liquid chromatography cyclic ion mobility (UHPLC-cIM) comprises ion mobility (gas phase separation prior to MS analysis) coupled with UHPLC (neutral species separation). Ion mobility separation is dependent on factors such as the mass of the ion, charge, dipole moment and shape. It provides an added dimension of separation to that of LC (hydrophobicity) and MS (m/z), and nowadays provides collision cross section (CCS) values as a complementary identification metric.
The routine use of ion mobility separation and CCS values for small molecule analysis has increased across multiple areas of research including pharma (metabolism, metabolomics, lipids), food safety (veterinary drugs, mycotoxins, steroids, steviol glycosides, natural product screening, natural toxins). CCS searchable libraries have been created, where use of a CCS metric can be used to increase cumulative specificity of identification, decrease false detections, and identify unknowns.
To instill confidence in the applicability of CCS values when performing PFAS non-targeted screening assays, we have used an internally developed PFAS library to cross correlate PFAS CCS reproducibility. An inter-site/intra-site comparison using SELECT SERIES Cyclic IMS system (see Figure 1) has been performed and compared to published drift tube ion mobility PFAS CCS values.8
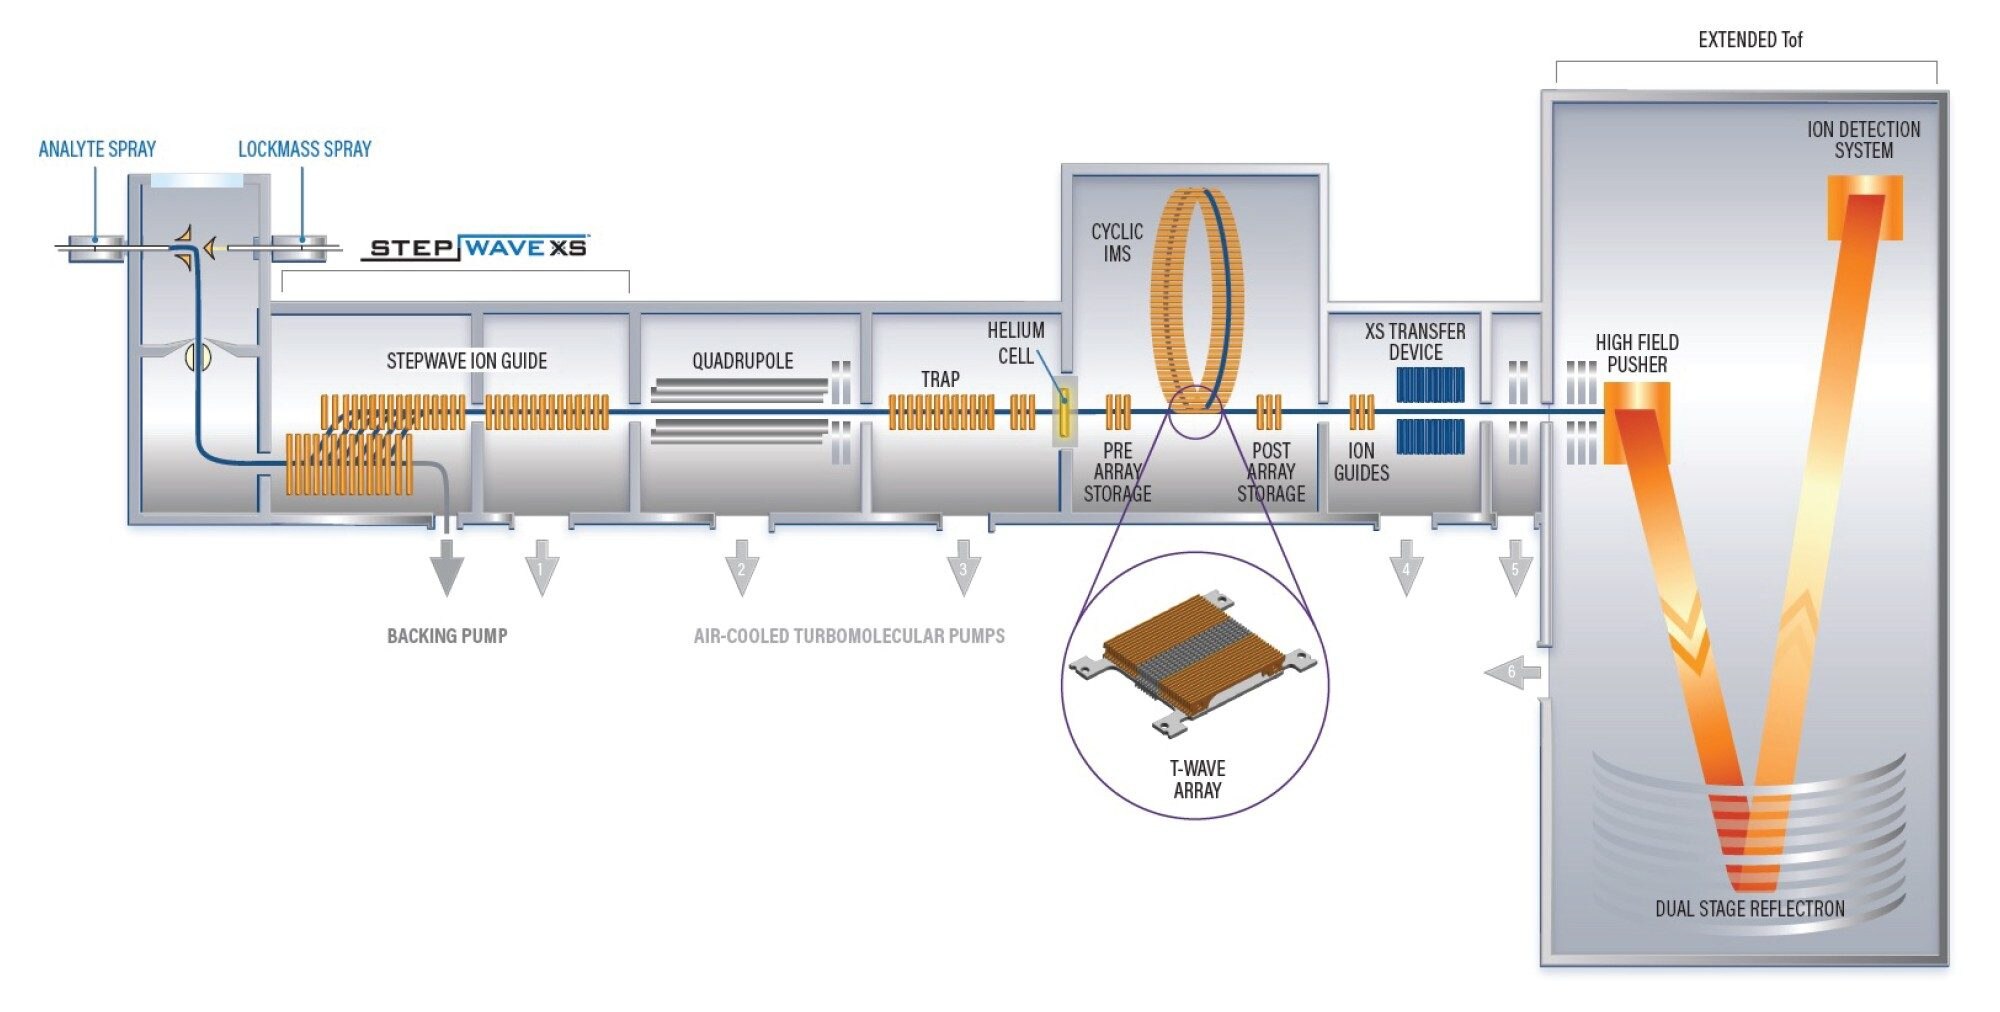 Figure 1. Schematic of SELECT SERIES Cyclic IMS mass spectrometer.
Experimental
Sample description
Native PFAS Solution/mixture: PFAC30PAR (Wellington Laboratories) and Waters™ LCMS QC Reference Standard (186006963),
Library: Waters PFAS library- (130 entries)
LC Conditions
|
LC system: |
ACQUITY™ Premier System modified with PFAS Kit and Atlantis™ Premier BEH™ C18 AX Isolator Column, 2.1 x 50mm, 5 µm (p/n 186010926).9 |
|
Column: |
ACQUITY UPLC™ HSS T3 C18 (100 mm x 2.1 mm, 1.8 µm) column |
|
Column temperature: |
35 °C |
|
Sample temperature: |
6 °C |
|
Injection volume: |
5 µL |
|
Flow rate: |
0.3 mL/min |
|
Mobile phase A: |
95 H2O (2 mM ammonium acetate):5 MeOH |
|
Mobile phase B: |
MeOH (2 mM ammonium acetate) |
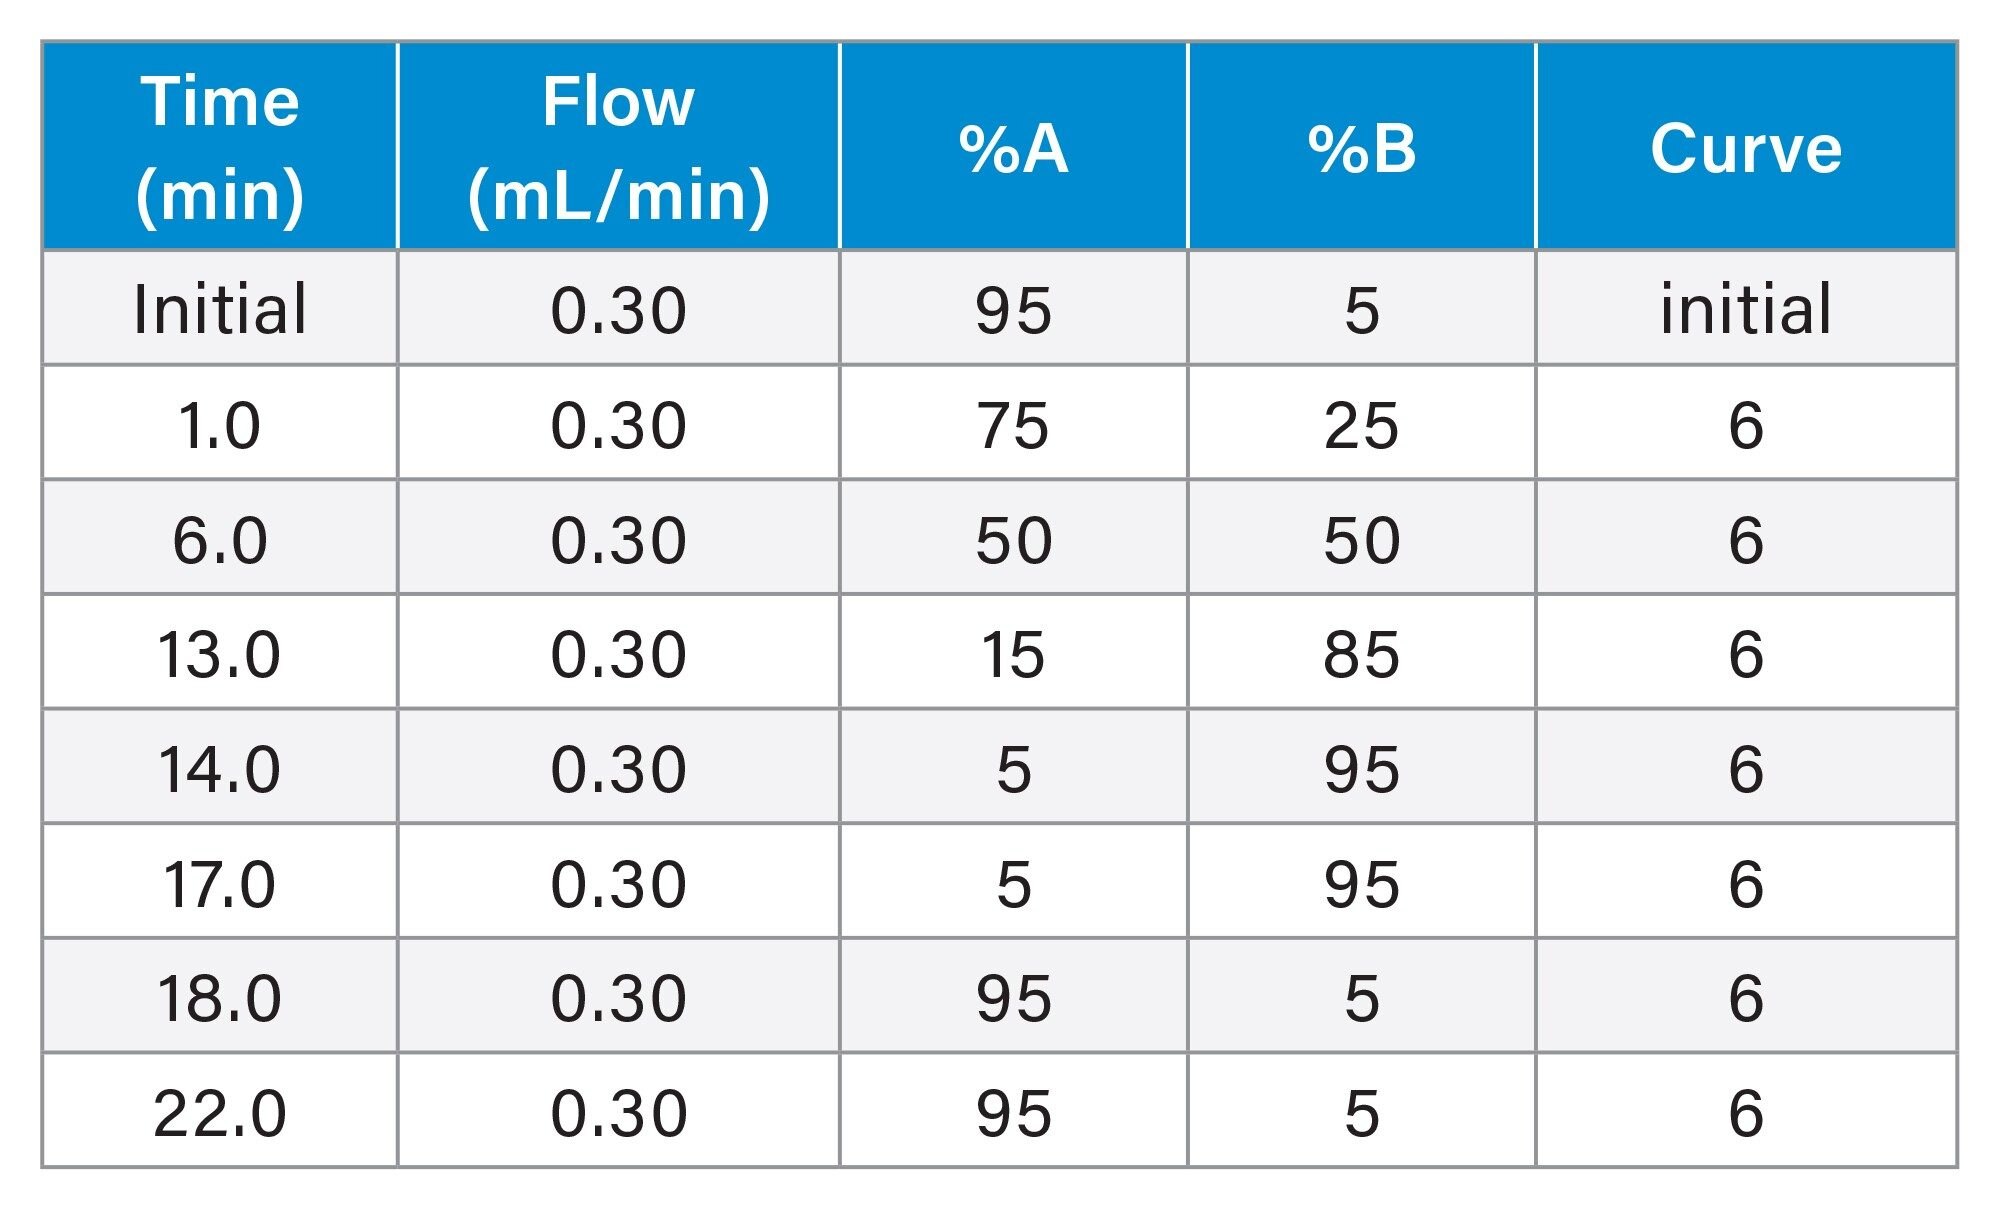
Gradient Table
MS Conditions
|
Ionization mode: |
ES- |
|
Acquisition range: |
m/z 50–1200 |
|
Capillary voltage: |
0.5 kV |
|
Collision energy: |
20–70 eV |
|
Cone voltage: |
10 V |
|
Desolvation temperature: |
250 °C |
|
Source temperature: |
100 °C |
|
Acquisition rate: |
0.2 seconds |
Data Management
|
Chromatography and MS: |
MassLynx™ 4.2 SCN1026 Software |
|
Informatics: |
Driftscope™ 3.0 and waters_connect™ 3.1.0.243 Software; Tibco Spotfire™ 6.0.0 Software (Palo Alto, CA). |
Results and Discussion
An advantage of non-targeted screening strategies using time-of-flight (Tof) mass spectrometry is the ability to acquire data for 1000’s of compounds in a single analysis, no preselection of target analytes is required, all the data is acquired all the time. The approach can be utilized to screen for large numbers of “known” PFAS, whilst simultaneously detecting PFAS biotransformation products and “unknown” PFAS species. The ability to perform retrospective analysis is an important advantage of non-targeted screening assays, and in the case of cIM-MS (cyclic ion mobility mass spectrometry), acquisition retrospective analysis can be performed based on both MS and CCS data. CCS values are generated for all detected analytes and adducts, the CCS values determined for unknown PFAS analytes, can be readily added to the PFAS library.
PFAS identification confidence can be increased using CCS values which provide an additional identification point alongside, precursor ion, product ion and retention times, when performing targeted data processing using libraries. Using the SELECT SERIES Cyclic IMS mass spectrometer, routine CCS calibration is performed during the mass calibration process. Subsequently prior to performing sample analysis, using the Waters LCMS QC reference standard, system performance may be determined. Typical system Δ CCS % is illustrated in Table 1, where an overall RMS Δ CCS of 0.6% was obtained.
Illustration of the utility of CCS to facilitate added specificity in PFAS non-targeted screening assays, is presented in Figure 2, where a mixture of PFAS analytes have been routinely identified using the Waters PFAS library, which comprises PFAS analyte retention time, precursor ion, expected product ions and PFAS CCS values for 130 entries. At the point of analysis, the analyst was not provided with information regarding the “blind test” sample (PFAC30PAR), and constituents were identified using the Waters PFAS Library (the PFAS listed targets of EPA 1633 and ASTM 8421 are constituents of the library).3,4 For the PFAS mixture analysed, HDMSE data was acquired over the concentration range (0.005 ng/mL to 10 ng/mL), a linear response (R2=0.99) is shown over 4.5 orders of dynamic range for PFOS (see Figure 2). From Figure 2, compared to the expected library values, Δ CCS <1% is obtained routinely. The observed and expected CCS values are fully integrated into the waters_connect software component summary table. The PFAS CCS values provide an additional identification point for monoisotopic MS data. This is advantageous at low intensities where characteristic PFAS fragment ions are not observed.
To instill further confidence in PFAS CCS values a SELECT SERIES Cyclic IMS intra-site/inter-site comparison has been performed. Previously acquired cIM data sets have been accessed to cross-correlate commonly detected PFAS analytes ([M-H]- and [M-CO2H]- adducts). The box plot schematic presented in Figure 3 shows comparable PFAS CCS values were obtained for two sets of CCS values determined at the Wilmslow UK laboratory and a third set of CCS measurements determined in the Waters US laboratory. For the intra-site and inter-site comparison performed, no outliers were observed and a cIM inter-site Δ CCS of 0.72% (RMS) was obtained.
Dodds et al. have previously demonstrated the use of LC-IM for PFAS analysis, using drift tube ion mobility derived CCS values.8 The published research facilitated a subset comparison of T-wave and DT PFAS CCS values generated using analytical standards. In Figure 4 (I) cIM and DT PFAS CCS values are presented as a scatter plot and visually it can be seen that the determined CCS values are comparable. However, in Figure 4 (II a) the comparison between cIM and DT PFAS CCS values has been displayed as a box plot (including distribution of CCS values for mixture of PFAS analysed). The comparison circles of the mean values of each respective box plot of the cIM and DT PFAS CCS values are also presented. In Figure 4, there appears to be one comparison circle, however the two respective comparison circles are overlaid, therefore indicating at the 95% confidence level there is no significant difference between the measured cIM PFAS CCS values and the published DT CCS values. Overall, a Δ CCS of 0.62% (RMS) was obtained. Incorporating inter-site cIM data, a subtle difference is observed for the mean PFAS CCS value, no significant difference is observed (see Figure 4 (II b)). In contrast, overall, a Δ CCS of 1% (RMS) was obtained. The results show that comparative CCS values can be obtained using different ion mobility technologies, which in turn provides enhanced confidence that CCS values can be used as an identification criterion for PFAS analytes, “knowns” and “known unknowns”.8
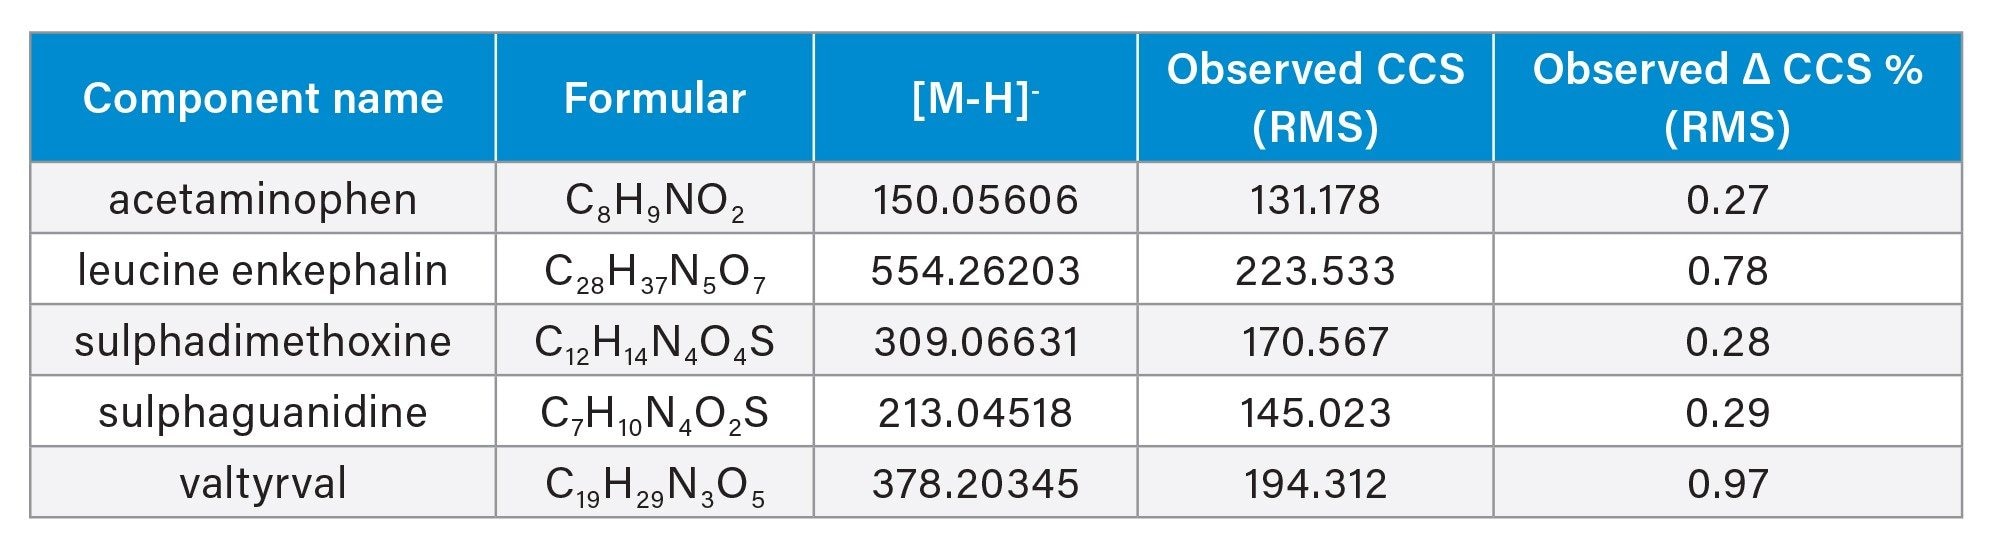 Table 1. Illustration of Δ CCS % obtained for cIM LCMS QC reference standard.
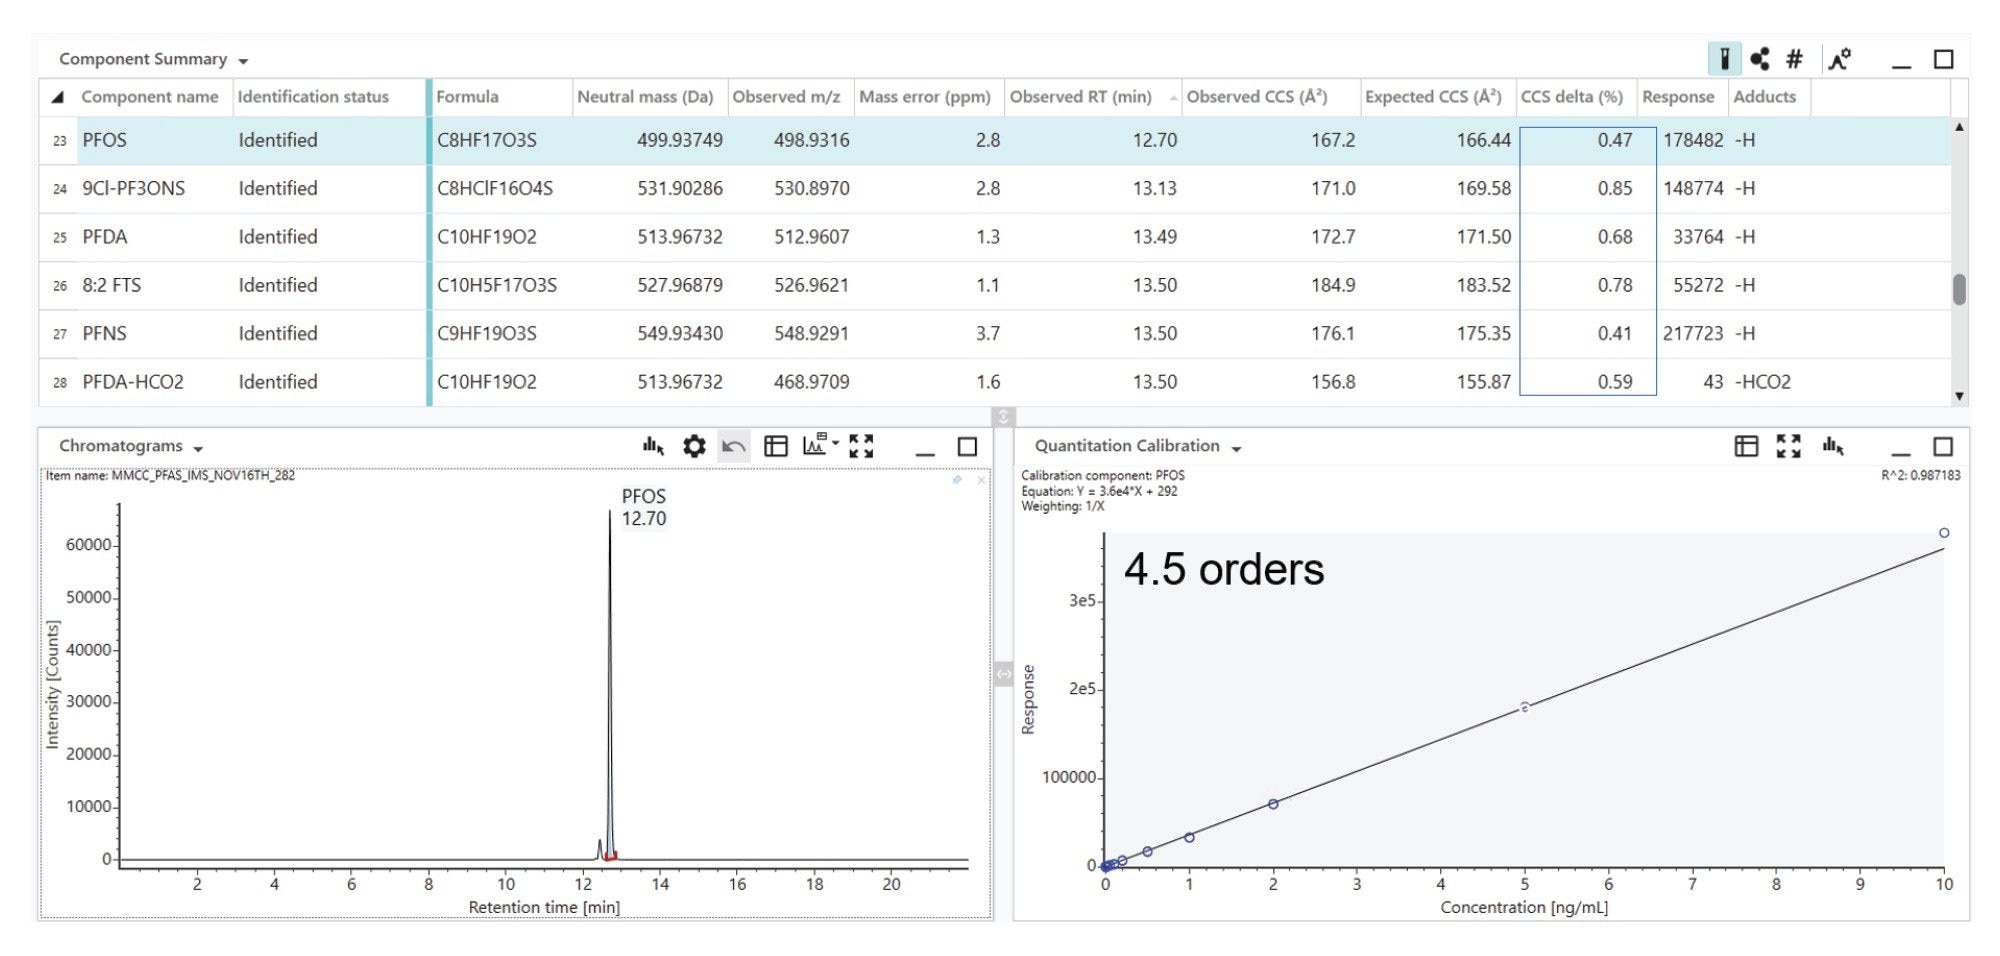 Figure 2. waters_connect software PFAS data review illustrating the linear response obtained for PFOS (5pg/mL to 10,000 pg/mL) and HDMSE library comparison CCS values determined for “PFAC30PAR”.
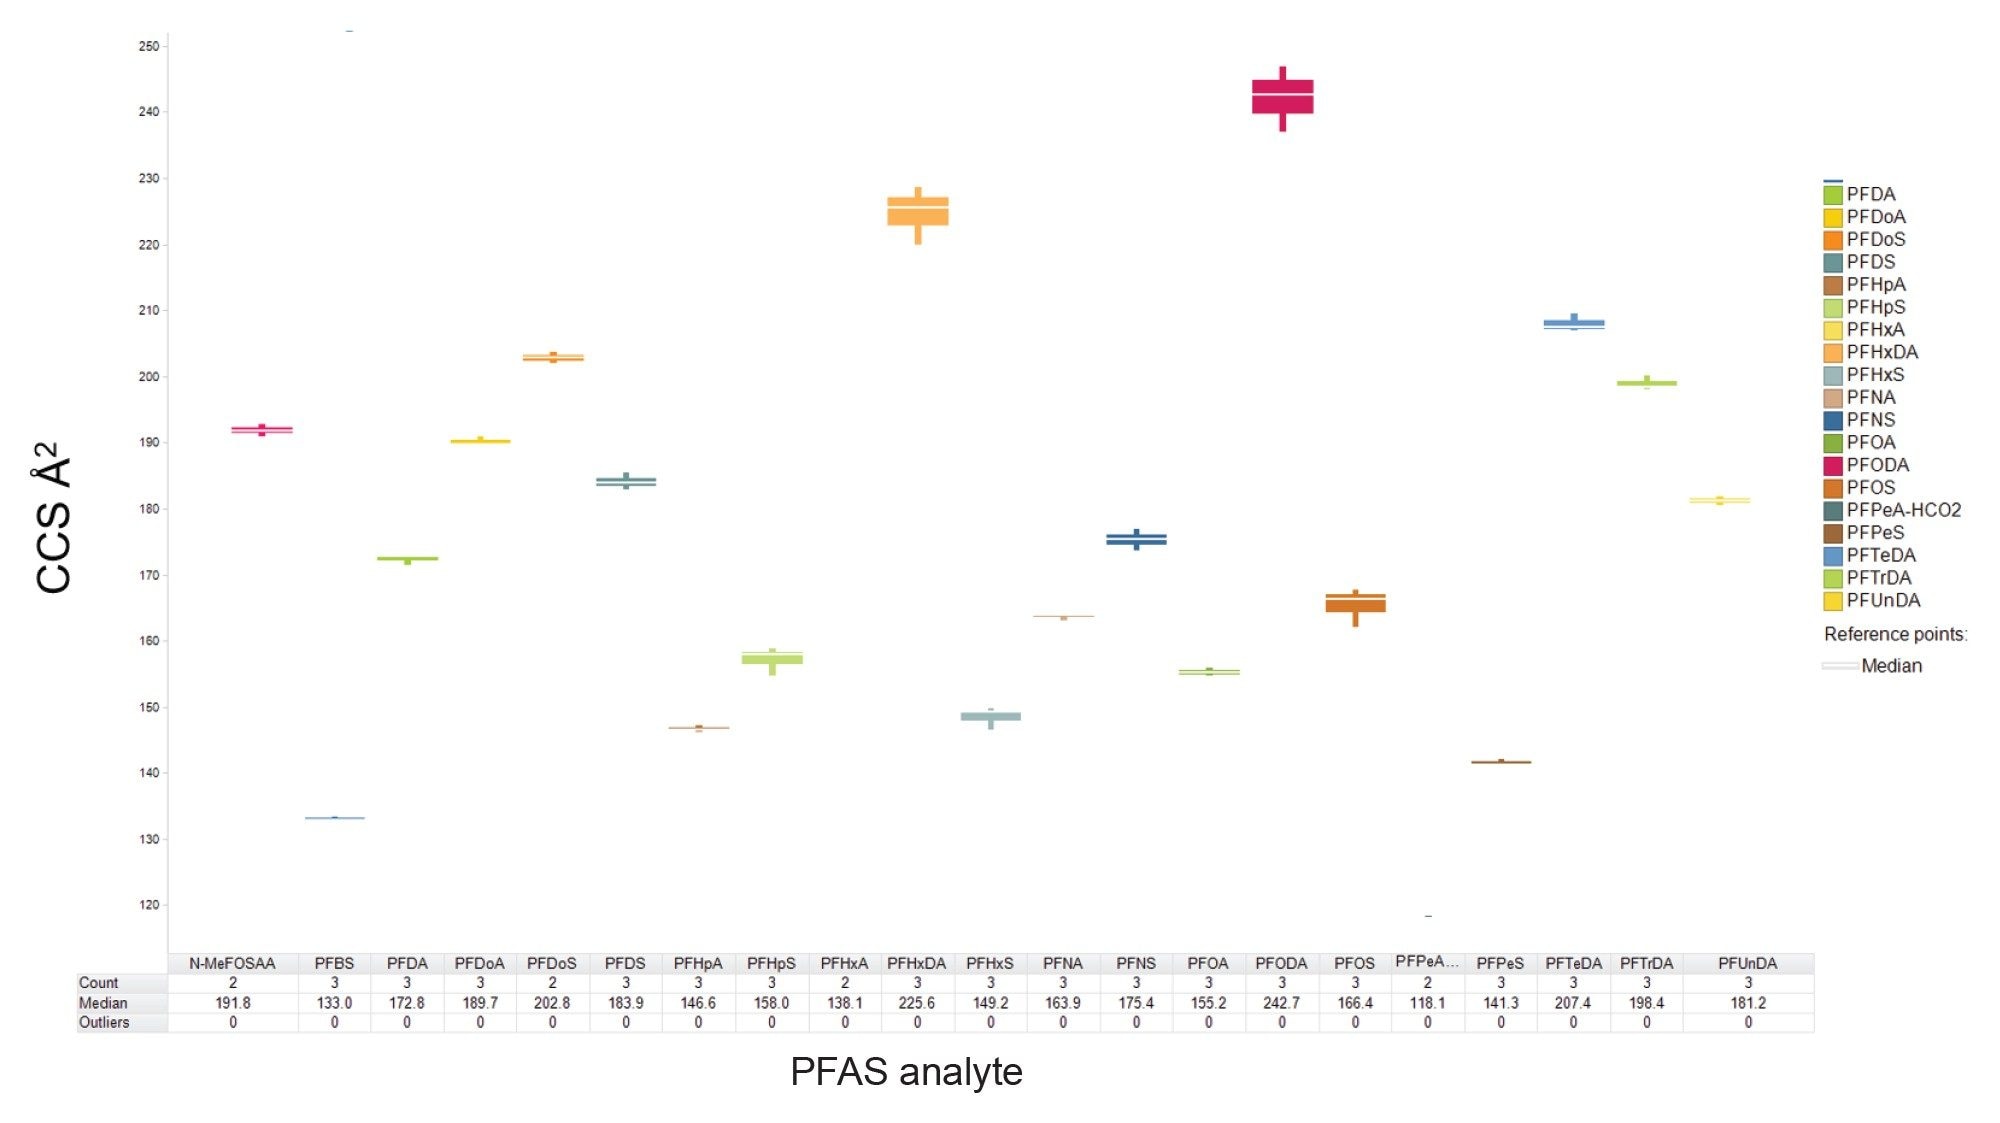 Figure 3. Schematic box plot for the distribution of measured SELECT SERIES Cyclic IMS TWCCSN2 values determined for PFAS analytes inter-site/intra-site comparison.
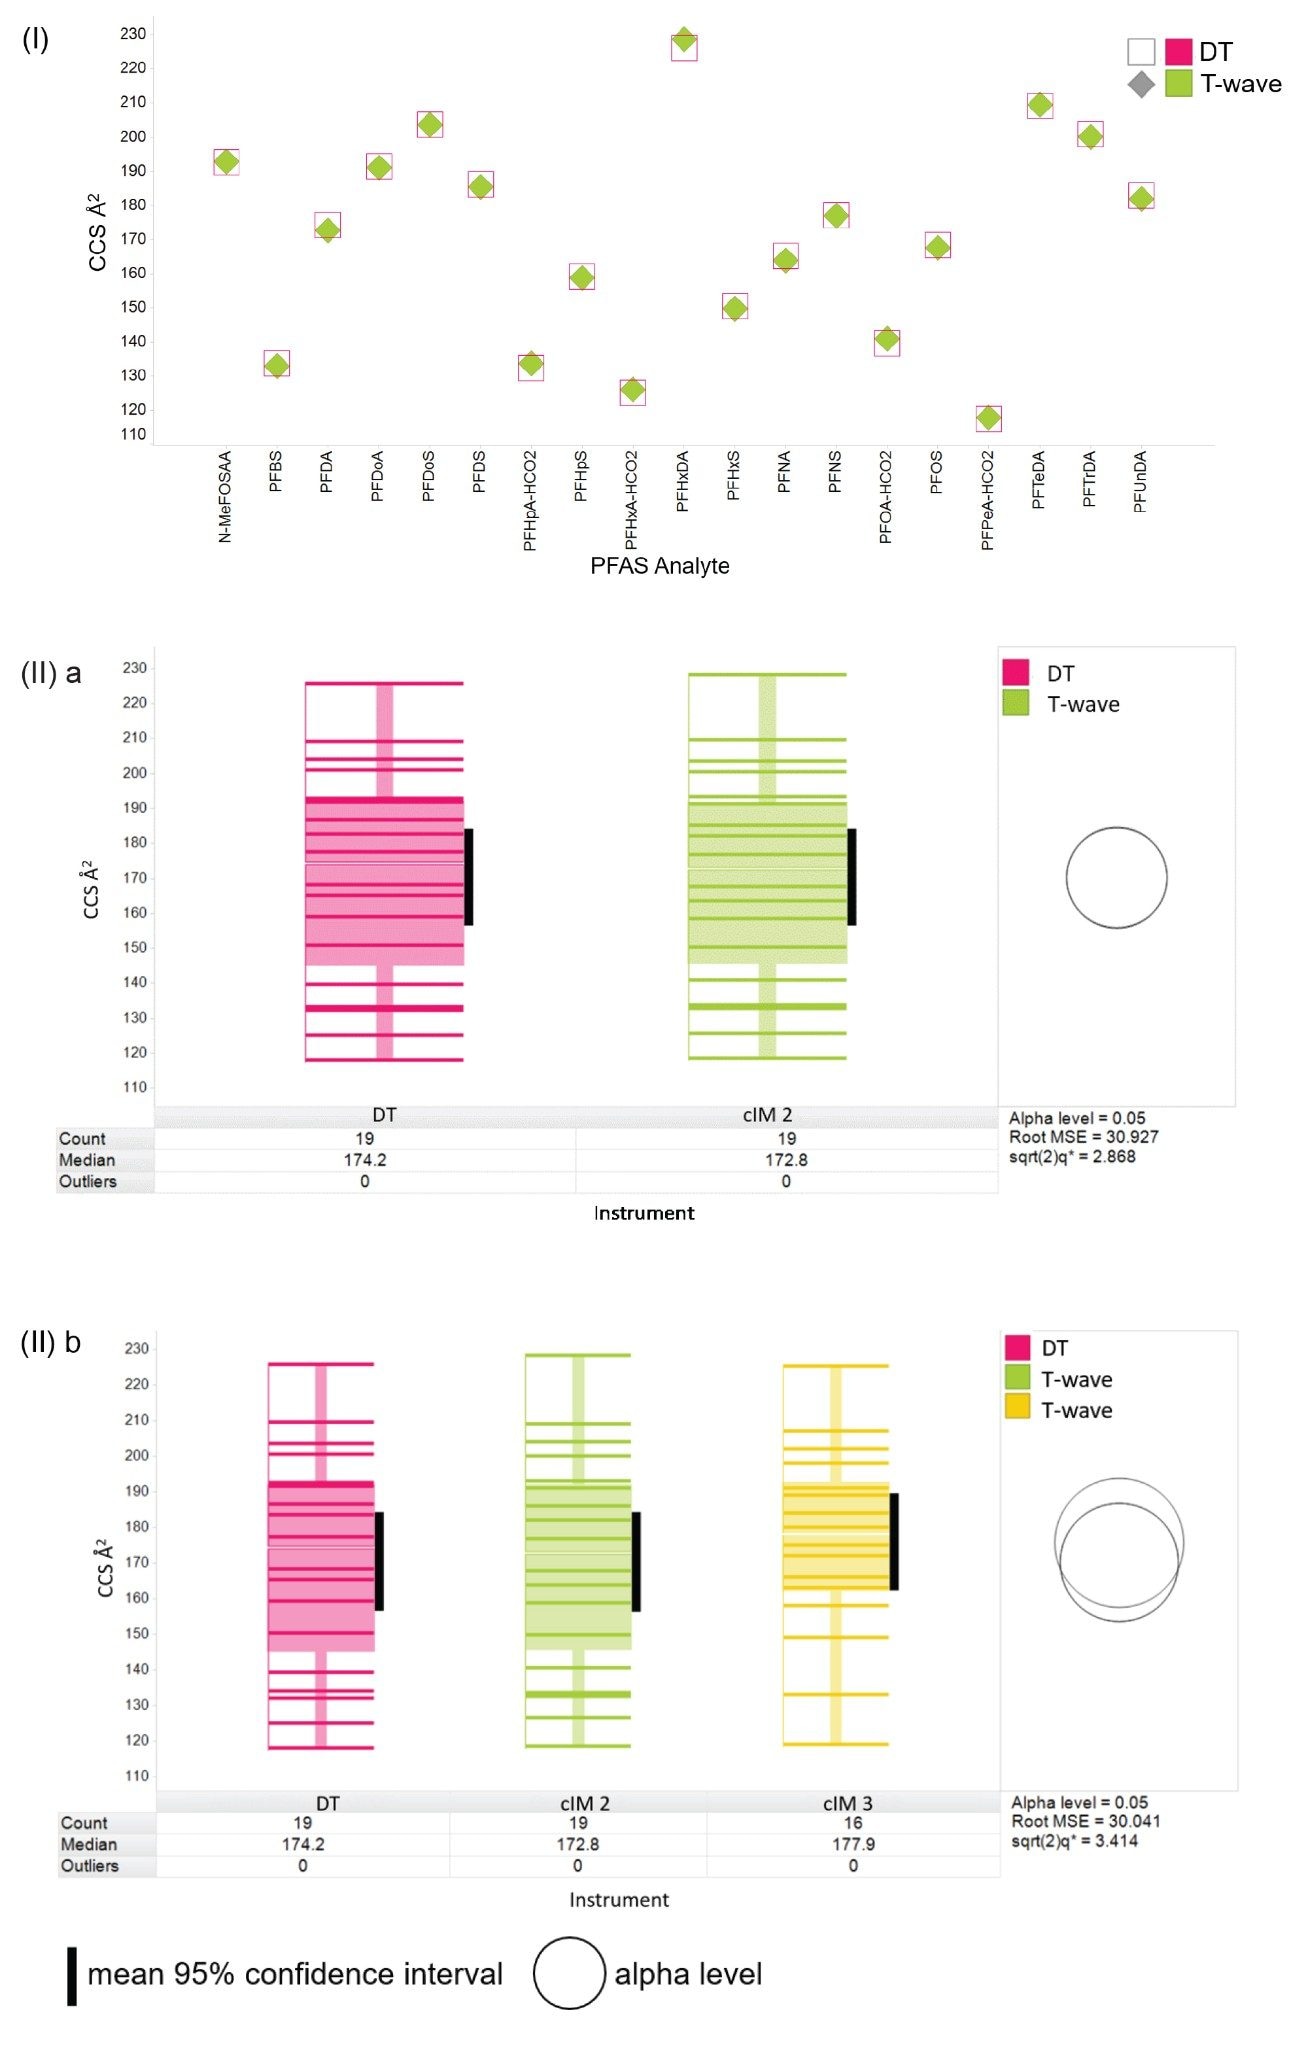 Figure 4. (I) Scatterplot comparison of PFAS cIM and DT CCS values. (II) Box plot statistical analysis ((a) intra-site and (b) inter-site) for the distribution of PFAS T-wave and DT ion mobility CCS values for determined using analytical standards.
Conclusion
PFAS CCS values have been shown to be reproducible for a cIM intra-site/inter-site comparison and when compared to published DT CCS values. A CCS measurement can be routinely obtained < 1% of the expected PFAS reference library value. Combined with retention time and m/z, a CCS value is a reproducible metric that can be used to improve cumulative specificity in non-targeted screening assays.
Products containing PFAS are embedded into the fabric of society, there has been a reduction in use of “traditional” PFAS, but they continue to be used in both developed and developing countries.
The legacy of PFAS prouction remains within the environment and therefore the risk of toxicological effects due to exposure remains. Understanding the impact of emerging PFAS is of equal importance. The enhanced specificity of HDMSE may be used to meet the analytical challenge of identifying PFAS “knowns” and characterise “unknown” PFAS analytes, as well as their corresponding biotransformation products.
References
- https://www.epa.gov/system/files/documents/2024-01/method-1633-final-for-web-posting.pdf.
- Directive (EU) 2020/2184 of the European Parliament and of the Council of 16 December 2020 on the Quality of Water Intended for Human Consumption (Recast) [Online] https://eur-lex.europa.eu/eli/dir/2020/2184/oj.
- ASTM Test Method D8241 Determination of Per- and Polyfluoroalkyl Substances (PFAS) in Aqueous Matrices by Co-solvation followed by Liquid Chromatography Tandem Mass Spectrometry (LC/MS/MS), https://www.astm.org/d8421-22.html.
- U.S. EPA Chemistry Dashboard, https://comptox.epa.gov/dashboard/chemical-lists/PFASSTRUCTboard (epa.gov) (ac cessed 2024–20-03).
- Stecconi T, Tavoloni T, Stramenga A, Bacchiocchi S, Barola C, Dubbini A, Galarini R, Simone Moretti, Gianni Sagratini, Arianna Piersanti. A LC-MS/MS Procedure for the Analysis of 19 Perfluoroalkyl Substances in Food Fulfilling Recent EU Regulations Requests, Talanta, Volume 266, Part 2, 2024, 125054, ISSN 0039–9140. https://doi.org/10.1016/j.talanta.2023.125054.
- Dreolin N, Adams S, Organtini KL, Hird S, Burt O. Analysis of 28 EU Regulated and Recommended PFAS in Food via LC-MS/MS – Part 1: Vegetable, Fruit, and Baby Food. Waters Application Note, 720008219, 2024.
- Routine Determination of Per- and Polyfluorinated Alkyl Substances (PFAS) in Drinking Water by Direct Injection Using UPLC-MS/MS to Meet the EU Drinking Water Directive 2020/2184 Requirements. Waters Application Note, 720007413, 2021.
- Dodds, J N, Hopkins ZR, Knappe DRU, and Baker ES. Rapid Characterization of Per- and Polyfluoroalkyl Substances (PFAS) by Ion Mobility Spectrometry–Mass Spectrometry (IMS-MS). Analytical Chemistry 2020 92 (6), 4427–4435. DOI: 10.1021/acs.analchem.9b05364
- PFAS Analysis Kit for ACQUITY UPLC Systems, User Guide, 720006689.
720008536, September 2024