Understanding Sample Complexity: Determining Matrix Effects in Complex Food Samples

While the hyphenation of chromatographic and mass spectrometry technologies has revolutionized food contaminant testing laboratories, one major drawback is the potential for the phenomenon of matrix effects. Due to unwanted interactions between the analytes and sample matrix, the analyte’s response may be reduced or amplified. The influence of matrix on the reliability of your method should be determined when implementing new methodologies, commodities or analytes into your laboratory’s analytical scope.
In GC-MS analysis, the presence of active sites on liners and analytical columns can encourage the adsorption of certain functional groups. Excess matrix, which is commonly present in food extracts, deactivates these sites and so the analyte’s response may increase relative to the same concentration in cleaner food or solvent based extracts. This phenomenon is, therefore referred to as matrix induced signal enhancement. In LC-MS analysis, electrospray ionization (ESI) remains the go-to ionization source in routine laboratories, due to its broad compound coverage capabilities. However, ESI is also renowned for significant impact on ionization efficiency in the presence of matrix, thus impacting the reliability of the detection.
So, what is matrix? The IUPAC Gold Book simply states that matrix is “the components of the sample other than the analyte”. [1] When we consider the variety of samples received into routine testing laboratories for contaminant and residue analyses, from acidic tomatoes to fatty edible oils, the scope of matrix components is vast. Understanding the representative commodity types your laboratory may analyze over the method’s lifetime helps guide on method development and optimization steps. In order to overcome the impact matrix has on the detection of our analytes of interest, we must first determine their presence.
Determining matrix effects
While several options are promoted to measure the impact of matrix on your analysis, the theory and basic practice is the same. These protocols include the post-column infusion method and post-extraction addition. [2,3] In this blog, we will focus on protocols relating to the latter, where a known concentration of analyte in solvent is compared against the same concentration spiked into the sample(s) after extraction. This comparison may be carried out on replicates (n=5 at least) at a fixed concentration (Equation 1) or on a calibration series (Equation 2) covering a wider concentration range, where all samples must be prepared to a similar solvent composition and acquired under the same conditions, within a single analytical run.
With the resultant data, the peak area of the analytes is compared, for example:
![]()
Equation 1: Calculating matrix effect factor
Where A: peak response of the analyte in the solvent standard and B: peak response of the analyte in the matrix matched standard (i.e. spiked into the food sample post-extraction).
If the result is less than zero (negative value) the analyte’s response is being suppressed by the matrix. If greater than zero (positive value) the analyte’s response is being enhanced by the matrix. As a rule of thumb, best practice guidelines recommend action is taken to compensate if effects are > 20%, thus minimizing the error in mis-reporting accurate concentrations of incurred residues. [4-6]
A graphical depiction of this calculation is shown below, where the analytes’ chromatographic peaks in solvent and matrices are shown. In Figure 1A, fipronil in both solvent (75:25 water: acetonitrile) and matrix (raw egg, extracted with QuEChERS and dilute, 75:25 water: acetonitrile) are overlaid. The y-axis (peak response) for both injections are linked, thus showing suppression of fipronil by the co-extracted matrix of the egg sample. Similarly, in Figure 1B, picolinafen spiked in solvent and soybean are overlaid, with the y-axis linked. In this example, picolinafen’s response in soybeans is significantly greater than in solvent. Using Equation 1, 30% suppression was determined for fipronil in egg and 40% enhancement was determined for picolinafen in soybeans. In both these examples, changes to the method would be required, in order to compensate for these matrix effects and ensure the reliable quantitation of incurred residues.

Similarly, to the previous method, sample sets in solvent and matrix are generated to the same solvent composition and acquired under the same conditions. The main difference in this method is the creation of calibration series, rather than replicates at a single concentration. The calibration series should be prepared in solvent and matrix, both at corresponding concentrations, over an appropriate, linear working range. Individual calibration curves are plotted for solvent and matrix, reporting the peak response of the analyte against the known concentration. From each curve, the equation of the line is determined and the slope of each is compared, as follows:
![]()
Equation 2: Calculating matrix effects from the slope of the curve
Where mA: slope of the line for the solvent based calibration series and mB: slope of the line for the matrix-based calibration series.
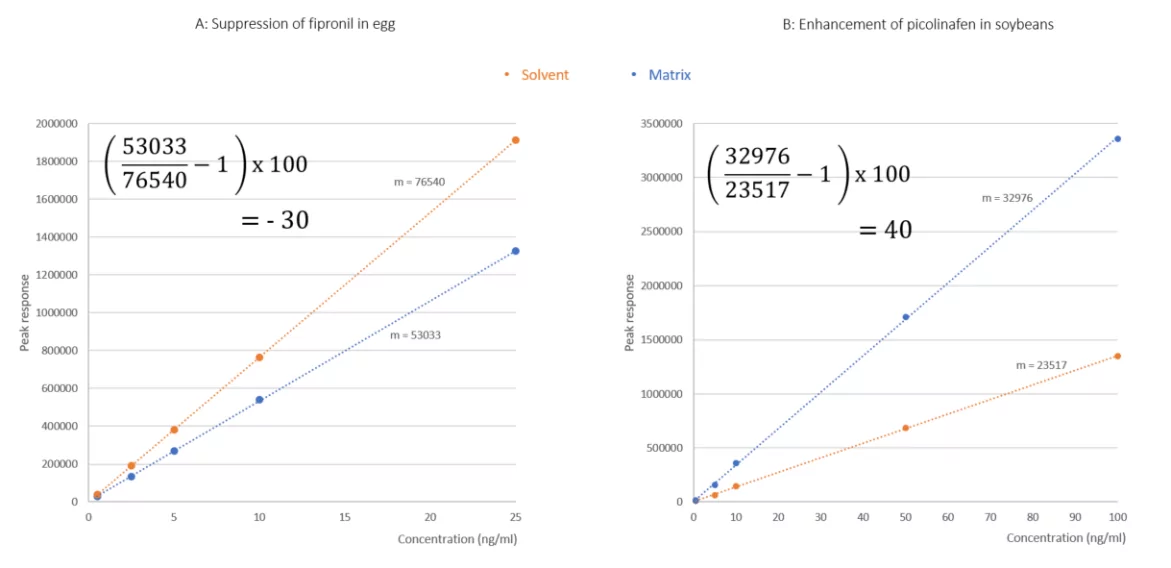
Taking the examples of fipronil in egg and picolinafen in soybeans discussed already, their calibration series, relative to solvent standards are overlaid for visual comparison. Slotting the calculated slope of each curve into each equation, again matrix effects of -30% and 40% were determined for fipronil and picolinafen, respectively.
The methods for the determination of matrix effects discussed here make use of matrix samples spiked after extraction, to limit any variation in the initial extraction of the analytes from the matrix. If we don’t extract the analyte efficiently to begin with, we may blame poor detection on matrix effects, rather than the absence of the analyte at the appropriate concentrations. Of course, prior to determining matrix effects, it is important to consider analyte extractability during the initial extraction steps of the sample preparation, if not already determined by previous reference methods or research. While such an exercise may be carried out using solvent based standards, the use of representative commodity types provides better visibility to true method performance and potential interactions with matrix. The efficiency with which a solvent can extract analytes from the matrix is readily determined in a similar manner to matrix effects:

Equation 3: Calculating analyte recovery by extraction
Where A: peak response of the analyte in the solvent standard and C: peak response of the analyte in the matrix extracted standard (i.e. spiked into the food sample pre-extraction).
Conclusion
When expanding your analytical scope, whether it be methodology, analytes or commodity types, it is important to understand the extractability of the analytes from the matrix and the effect the co-extracted matrix has on the analyte detection. These factors can be readily determined from the acquisition of several spiked solvent and food samples, where the solvent composition and acquisition parameters should be constant, to ensure any and all variability is due to matrix alone. Once the effect of matrix on analyte detection has been determined, values signifying greater than 20% suppression or enhancement typically require action to compensate for these effects. We’ll be covering what these best actions may be for your laboratory, in our next blog on solutions to overcoming matrix complexity.
References/ information sources:
[1] IUPAC Gold Book, International Union of Pure and Applied Chemistry’s Compendium of Chemical Terminology, 2019.
[2] M. Twohig, J. Mather, A. Hooper, A Tool for Robust Analytical Methods Development, Waters’ Application Note, 2010.
[3] B.K. Matuszewski, M.L. Constanzer, C.M. Chavez-Eng, Strategies for the Assessment of Matrix Effect in Quantitative Bioanalytical Methods Based on HPLC−MS/MS, Anal Chem., 75, 13, 2003.
[4] EURL Pesticides Network, Analytical Quality Control and Method Validation Procedures for Pesticide Residues Analysis in Food and Feed, SANTE/12682/2019, 2019.
[5] US FDA, Guidelines for the Validation of Chemical Methods in Food, Feed, Cosmetics, and Veterinary Products, 3rd Edition, 2019.
[6] LGC National Measurement System, Guide to achieving reliable quantitative LC-MS measurements, First Edition, 2013.
[7] Eurachem, The Fitness for Purpose of Analytical Methods A Laboratory Guide to Method Validation and Related Topics, Second Edition, 2014.
Related posts

How Waters is Helping to Solve the Global PFAS Problem
Waters instruments are helping our customers to identify PFAS at very low levels to study their persistence and toxicity, as governments work to develop plans to remove them from our environment.

Solutions in Sustainable Food Supply
As the world looks to provide enough protein to an increasing global population, cultivated meat and dairy products could be one sustainable solution.

The Waters Difference: Sustainable Actions for a Sustainable Future
At Waters our position as a global manufacturer is to embrace a culture of sustainability in our people, manufacturing, workspaces, products, services, and packaging.
Popular Topics
ACQUITY QDa (16) bioanalysis (11) biologics (14) biopharma (26) biopharmaceutical (36) biosimilars (11) biotherapeutics (16) case study (16) chromatography (14) data integrity (21) food analysis (12) HPLC (15) LC-MS (21) liquid chromatography (LC) (19) mass detection (15) mass spectrometry (MS) (54) method development (13) STEM (12)